What is the Goodness of Fit in the Linear Model?
- patilpramod6396
- Jun 14, 2021
- 2 min read
Linear regression tries to fit the line In a way that the distance between the fitted line and actual data point is minimized.
We can fit the line with the help of ordinary least squares (OLS) which minimizes the sum of the squared residuals (residuals means dist between actual and predicted data point) but we don't know how good this fitted line is then R-Square come into picture which tells us the goodness of fit.
By definition R-square is variation explain by model divide by total variation, it seems complicated let's make it simple with an example.
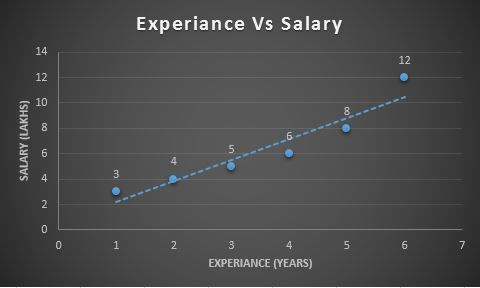
Find below chart we are predicting Salary (dependent variable) with Experience in Years (Independent variable) and we are done with fitting the line so consider the dotted line as the best-fitted line.

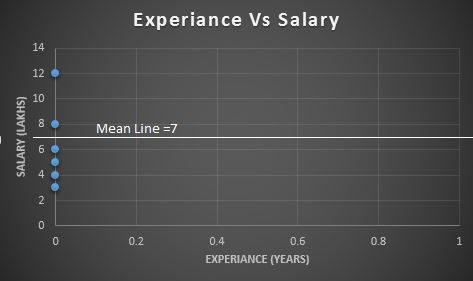
Let's shift all the data points to the Y-axis to emphasize that, at this point, we are only interested in Salary.

Sum the squared residuals Just like in the least-squares, we measure the distance from the mean to the data point and square it, then add those squares together. We called this as "Sum of Squares residuals around the Mean"
SS(Mean) = (data point -Mean) **2
SS(Mean)= (12-7)**2 + (8-7)**2 + (6-7)**2 + (5-7)**2 + (4-7)**2 + (3-7)**2 = 56
Variation around the mean (Var(Mean)) =SS(Mean) / n ( n = Number of data points)
Var(Mean) = 56/6 = 9.33

Now, let's calculate the sum of the squared residuals around our least-square line or best fit line. We called this as "Sum of Squares residuals around the best-fitted line"
SS(Fit) = (data point - point on line)**2
SS(FIt) = (3 - 2)**2 + (4 - 3.9)**2 + (5 - 5.5)**2 + (6 - 7.2)**2 + (12- 10.2)**2 = 5.94
Variance around the Fitted line (Var( Fit)) = SS (Fit) /n ( n = Number of data points)
Var (Fit) = 5.94 /6 = 0.99
By this, we conclude that there is less variation around the line that we fit by least squares. We can say that some of the Variation in Salary is explained by taking Experience into accounts.
R-Squares tells us how much of the Variation in Salary explained by taking Experience into accounts.
R-Square = (Var (Mean)- Var(Fit)) / Var(Mean)
R-Square = (9.33-0.99) / 9.33 = 0. 89 = 89 %
We can say that an 89 % reduction in variance when we take the Experience into accounts. Alternatively, we can say that " Experience explains 89% of the variation in Salary"
R-Square measure between 0 and 1 which calculates how similar a regression line is to the data it’s fitted to. If it’s a 1, the model 100% predicts the data variance; if it’s a 0, the model predicts none of the variances.


Comments